How Golf Betting Odds Work: Formats, Movement and Value
 Available in US
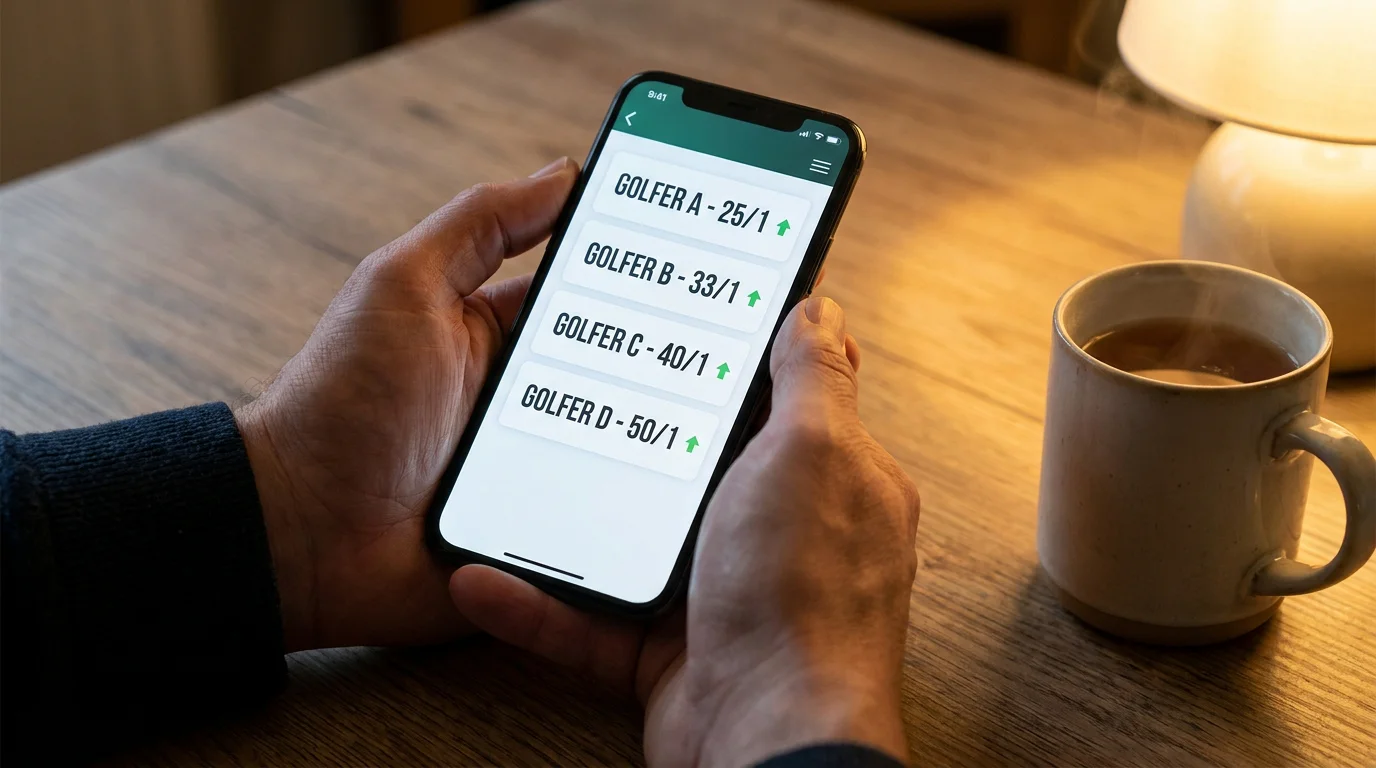
Table of Contents
- How Golf Betting Odds Work: A UK Punter’s Breakdown
- Fractional, Decimal and American: Reading Golf Odds in Any Format
- Implied Probability and the Overround
- How Golf Odds Move In-Play: Triggers and Patterns
- Comparing Golf Odds Across UK Bookmakers
- Common Odds Traps in Golf Betting
- Golf Odds: Your Questions Answered
- Reading Odds Is the First Step – Using Them Is the Edge
How Golf Betting Odds Work: A UK Punter’s Breakdown
The moment that taught me how golf odds actually work was not a winner. It was a 33/1 shot who finished second by one stroke at the 2017 PGA Championship. I had backed him each-way, and while the place return was decent, I remember staring at my bet slip realising I had no idea how to calculate what I was actually owed. I knew the odds. I did not understand them.
Golf betting odds are fundamentally different from odds in most other sports. In football, the favourite might be 4/5 – a price that implies roughly a 56% chance of winning. In golf, the tournament favourite at a major championship is typically 8/1 or 9/1, implying barely a 10-11% chance. A field of 144 players means that even the best golfer on the planet loses the vast majority of tournaments, and the odds reflect that mathematical reality in a way that can mislead punters accustomed to shorter-priced sports.
The UK sports betting market is valued at roughly $11.2 billion and projected to reach $21.3 billion by 2030. Golf’s share of that market is growing faster than the average, which means more money flowing into golf odds, sharper pricing, and a narrowing window for finding value. Understanding how golf betting odds work – the formats, the maths, the in-play triggers, and the traps – is not an academic exercise. It is the foundation of every profitable golf betting decision you will ever make.
I wrote this guide for the punter who knows what 25/1 means in a general sense but wants to understand why those odds move, what they really imply, and how to identify when a price is genuinely generous versus when it is a trap.
Fractional, Decimal and American: Reading Golf Odds in Any Format
I once watched a friend place a golf bet at decimal odds of 51.00 without realising it was the same as 50/1 in fractional. He thought he was getting a completely different price. That confusion is more common than the industry admits, and it costs punters money when they cannot quickly compare prices across bookmakers using different default formats.
Fractional odds remain the UK default and the format most British punters grew up with. When you see 25/1, it means you win £25 for every £1 staked, plus your stake back. The number on the left is your profit; the number on the right is the unit you risk. Simple enough for a single bet, but fractional odds become awkward when the numbers are irregular – 11/4, 15/8, 100/30 – and mentally converting them to probability on the fly is harder than it should be.
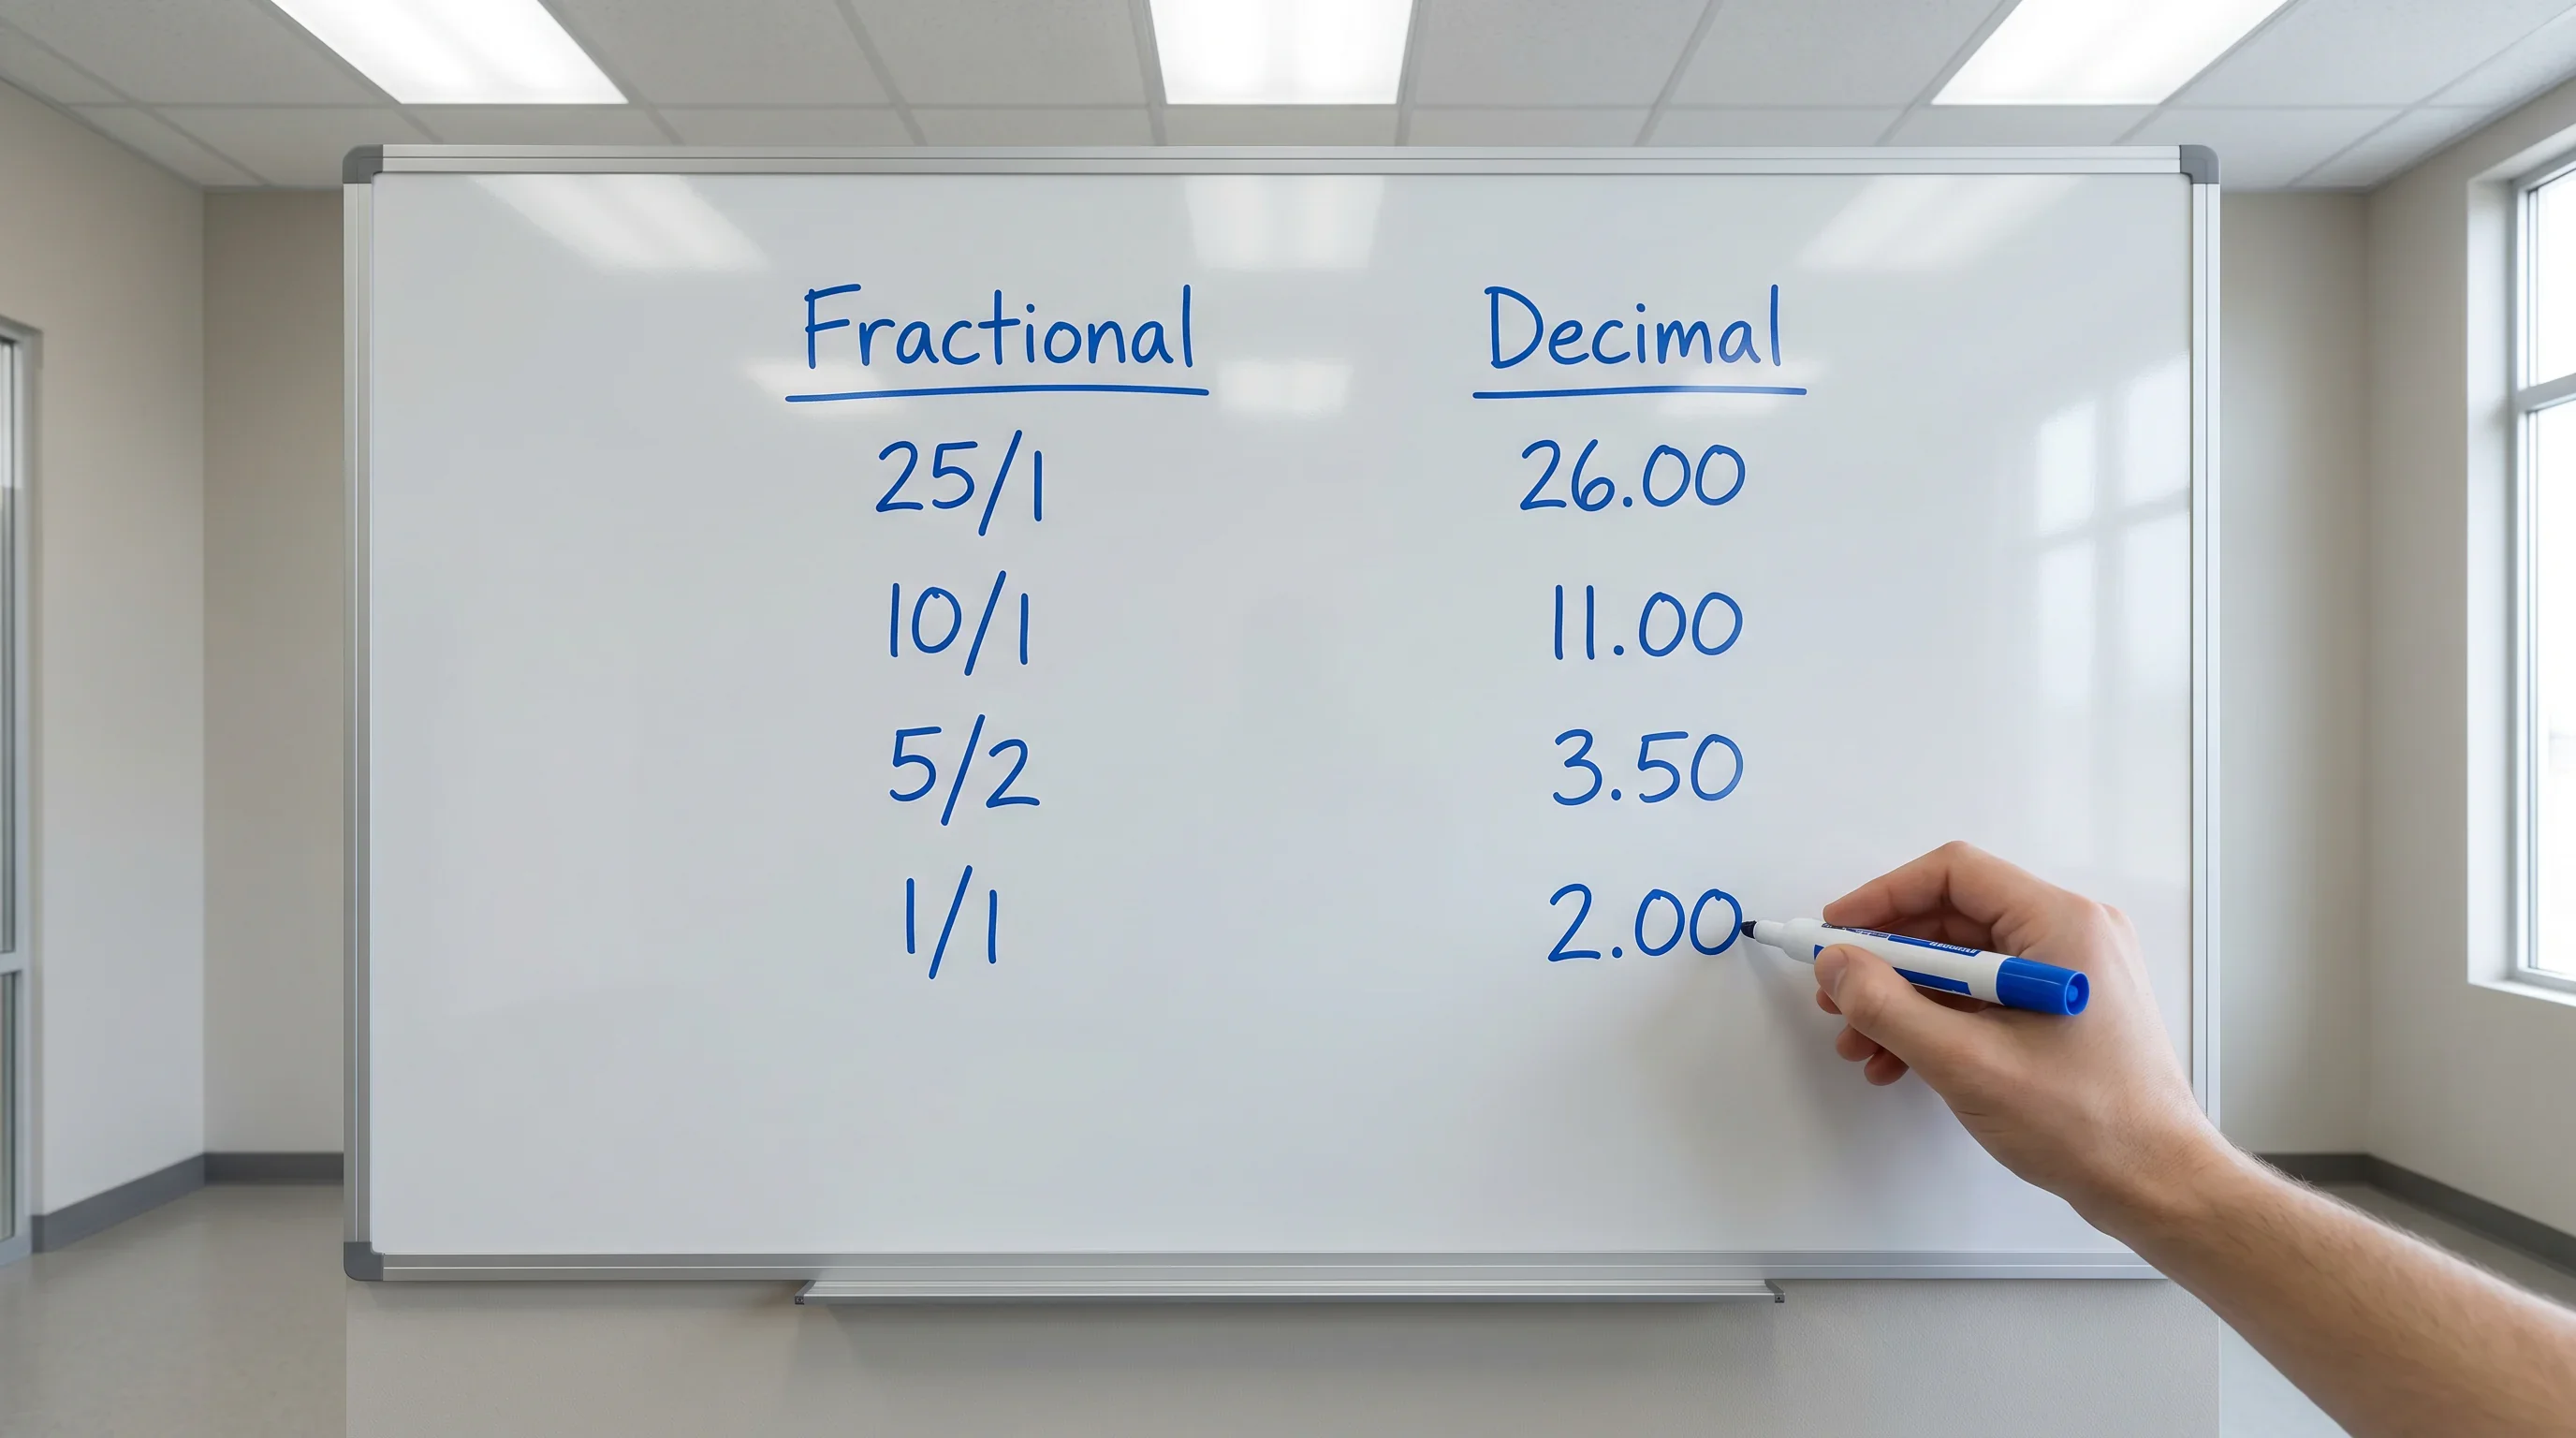
Decimal odds express the total return per unit staked. A price of 26.00 means £26 back for every £1 bet, which includes your original stake. The equivalent fractional odds would be 25/1. The conversion formula is clean: decimal odds minus one equals the fractional profit per unit. Where decimal odds genuinely help is in comparing prices quickly. Is 17/2 better or worse than 9.50? In fractional, you need to divide 17 by 2 to get 8.50, then add 1 to get 9.50. In decimal, the answer is immediate – 9.50 and 9.50, they are identical.
American odds, also called moneyline, are less common in UK golf betting but appear on US-facing platforms and some exchange markets. A positive number like +2500 tells you the profit on a £100 stake (£2,500 profit, or 25/1 fractional). Negative numbers indicate how much you must stake to win £100, but in golf, you will almost never see negative American odds because even the favourite is at long odds relative to other sports.
Most UK bookmakers now let you toggle between formats with a single click, and I would strongly recommend switching to decimal as your default. The mental arithmetic is faster, comparison is easier, and when you start calculating implied probabilities – which we are about to – the formula from decimal odds is the simplest of the three formats.
Implied Probability and the Overround
Every price a bookmaker offers carries a hidden number that most punters never calculate. That number is the implied probability – the percentage chance the odds suggest a player has of winning. If you cannot convert odds to probability, you cannot identify value, and identifying value is the entire game.
The formula from decimal odds is straightforward: implied probability equals 1 divided by the decimal odds, multiplied by 100. A player priced at 11.00 (10/1 fractional) has an implied probability of 9.09%. A player at 51.00 (50/1) implies 1.96%. A player at 6.00 (5/1) implies 16.67%. The calculation takes three seconds on a phone, and once you start doing it automatically, you will never look at golf odds the same way.
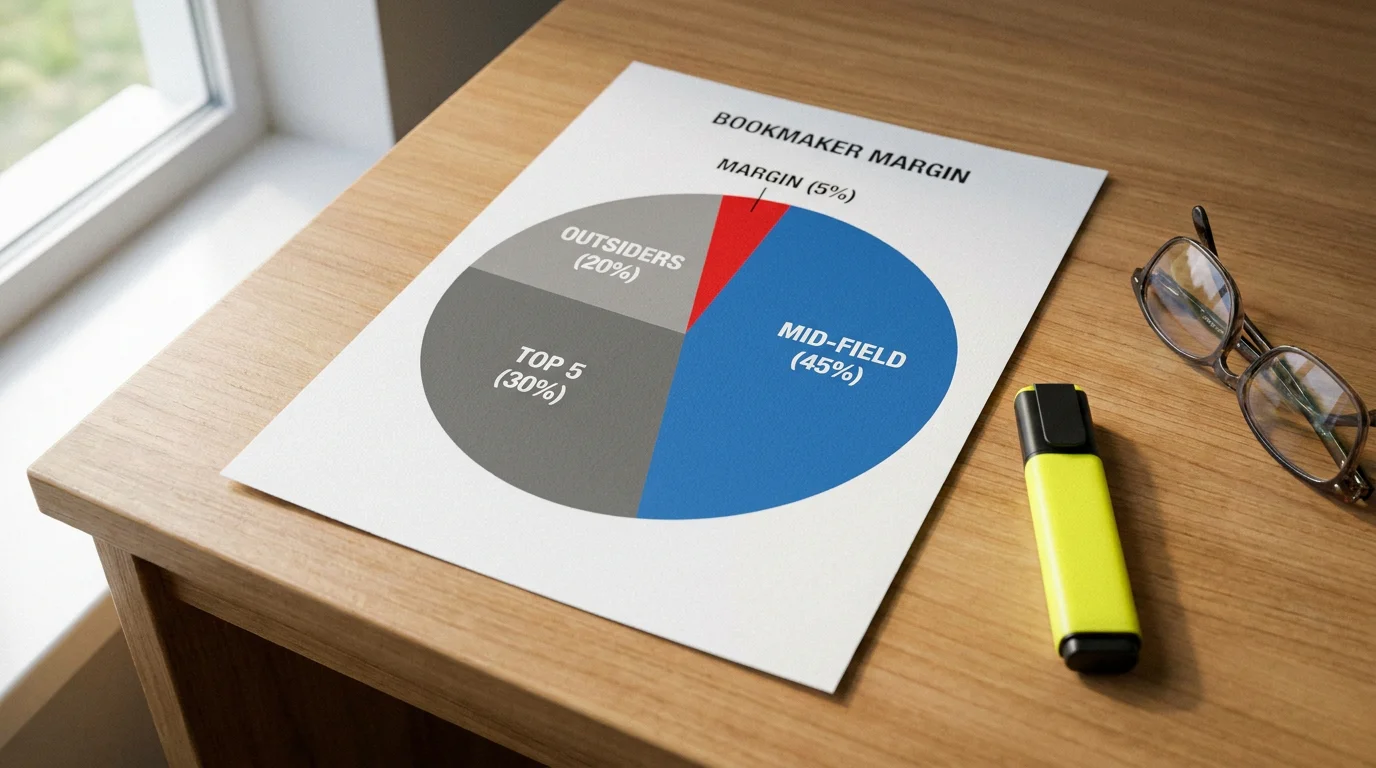
The catch is the overround, which is the bookmaker’s built-in margin. If you add up the implied probabilities of every player in a tournament outright market, the total should be 100% in a perfectly fair market. It never is. A typical golf outright market sums to between 115% and 135%, meaning the bookmaker has built a 15-35% margin across the field. Sports betting holds the largest share of UK online gambling revenue at 57.1%, and that revenue comes largely from this embedded margin.
The overround is not distributed evenly. Bookmakers tend to apply a larger margin to long-odds players (100/1 and above) and a thinner margin to the top of the market. A player who “should” be 80/1 on a fair book might be priced at 66/1 – the bookmaker has shaved the odds to build margin. A player who should be 8/1 might be priced at 15/2 – the margin is thinner because the market-leading names attract the most scrutiny and the most handle.
For practical purposes, I calculate the overround for each tournament market I bet into and compare it to historical averages. A market with a 120% total is relatively competitive. A market at 140% is thick with margin, and finding value becomes significantly harder. I also track whether the overround shifts in-play – it often tightens on Sunday as the field narrows and the bookmaker has more data to price the remaining contenders efficiently.
How Golf Odds Move In-Play: Triggers and Patterns
Scott Warfield of the PGA Tour said it clearly: “We feel pretty confident based on the stickiness that we saw last year that if we can get people in, they stay.” That stickiness is driven largely by how golf odds move in-play – the constant recalculation, the momentum swings, the volatility that keeps punters engaged for four consecutive days. Understanding the triggers behind those movements is not optional for anyone betting live.
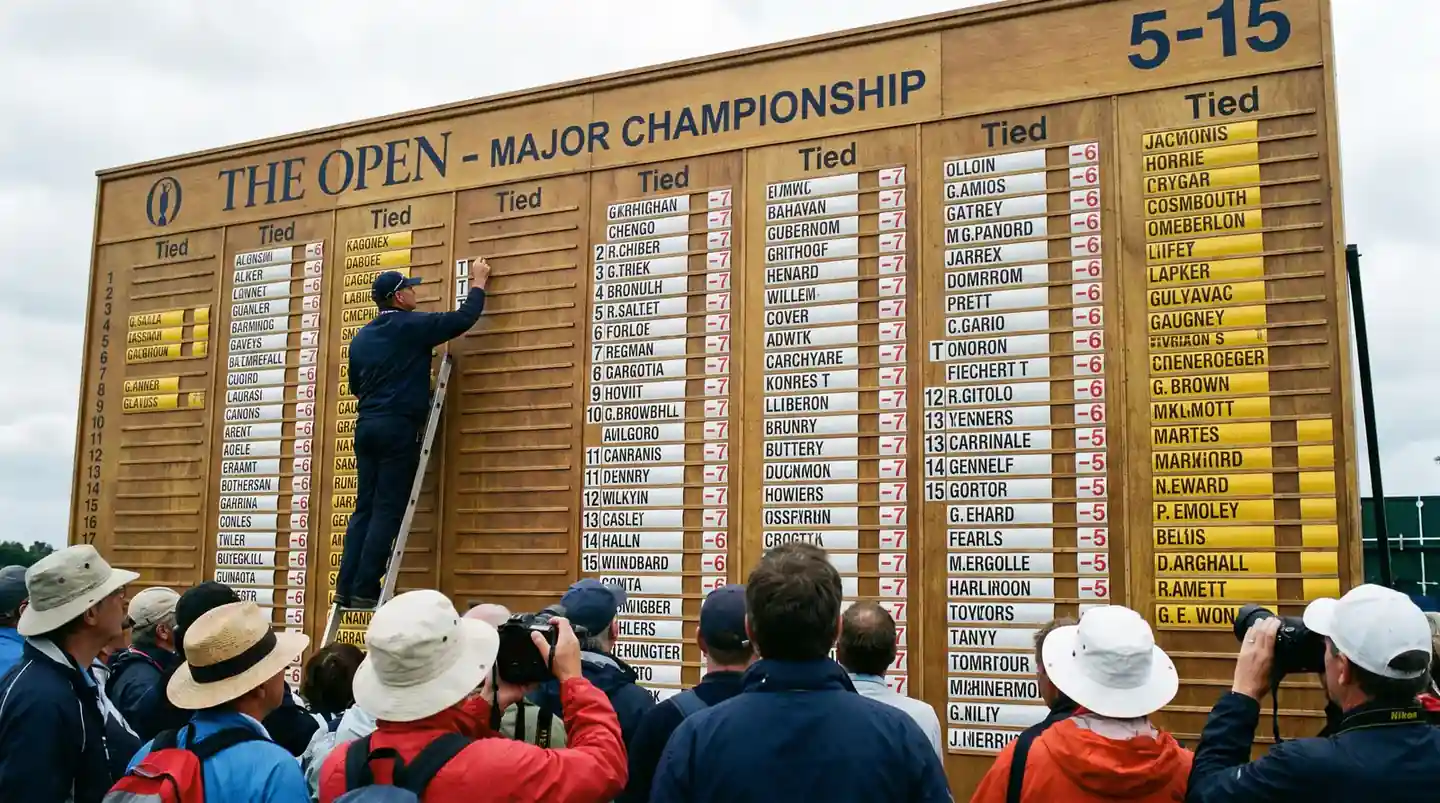
Golf odds are more volatile in-play than any major team sport, and the reason is structural. In football, two teams produce a limited number of scoring events per match. In golf, 144 players produce hundreds of scoring events per round, and each one has the potential to move the market. An eagle on a par-5 by a player sitting 15th compresses his outright odds and simultaneously drifts the odds of everyone above him on the leaderboard. A triple bogey by the leader sends ripples across the entire market. The interdependency of golf odds – where one player’s score affects every other player’s price – creates a level of complexity that no other sport matches.
Steamers and drifters are the vocabulary of in-play odds movement. A steamer is a player whose odds are shortening rapidly because money is flowing in – either because of on-course performance or because sharp bettors have identified an edge. A drifter is the opposite: odds lengthening as the market loses confidence. In golf, a player can go from steamer to drifter and back within the space of three holes, which is part of what makes the sport so compelling for in-play wagering.
The triggers that move golf odds in-play fall into four categories. Scoring events are the most obvious – birdies, bogeys, eagles, and doubles. Weather changes are the second trigger, because a forecast shift from calm to windy affects the entire afternoon wave simultaneously, and the market must reprice 70 players at once. Player withdrawals are the third trigger, removing a competitor from the field and subtly improving the implied probability of every remaining player. The fourth trigger is what I call “context shifts” – a rules official’s decision, a course setup change between rounds, or a grouping reshuffle after a withdrawal. These are less dramatic but equally capable of moving prices for attentive punters who track information the casual market ignores.

Timing the market after a trigger is where the skill lives. Live betting became the leading category globally in 2024 by volume, and the speed of price adjustments has increased accordingly. A birdie from the tournament leader used to take 60-90 seconds to fully price in. Today, the automated systems that most bookmakers use compress that window to 20-30 seconds. If you are not watching the live feed and the scoring data simultaneously, you are trading on stale information – and in a market this fast, stale information is a losing strategy.

One pattern I have found consistently profitable is the “Sunday morning drift.” Before the final round begins, the market reprices based on overnight analysis and early-morning punter activity. Players in the top five tend to see their odds shorten slightly as recreational bettors back the leaders. Players sitting 8th to 15th often drift despite having a realistic chance of contending. That drift between 7am and the first tee time on Sunday is a reliable entry point for top-10 bets on players the casual market has overlooked. For a deeper framework on identifying mispriced odds in-play, finding value in live golf bets covers the full methodology.
Comparing Golf Odds Across UK Bookmakers
If you are placing a golf bet at the first price you see, you are leaving money on the table every single week. William Hill and Bet365 command more than 50% of click share on sports betting queries in the UK, which means the majority of punters are comparing two bookmakers at most. The odds variance on golf across UK operators is consistently wider than on football or horse racing because golf markets are less liquid, and each bookmaker’s trader makes independent judgements about a 144-player field.
On a typical PGA Tour event, the outright odds for a player outside the top 20 in the market can vary by 20-30% across five major UK bookmakers. I have seen the same player priced at 40/1 on one platform and 55/1 on another – not during a fast-moving in-play market, but pre-tournament, with all the same information available. That price discrepancy is free value for any punter willing to spend two minutes checking.
Odds comparison tools like Oddschecker aggregate prices across UK operators in real time. I check them before every bet, pre-tournament and in-play. The comparison takes less than a minute and regularly adds 10-15% to my expected return on a single wager. Over a full season, that compounding difference between accepting the first price and shopping for the best price is substantial – it can be the margin between a losing year and a profitable one.

Best-price guarantees, where a bookmaker promises to match or beat the best odds available at the time of bet placement, exist on some platforms but are rare for golf. The more practical approach is to hold accounts with four or five UK-licensed operators and place each bet with whoever offers the longest price. It is tedious. It is also one of the simplest edges available in golf betting.
Common Odds Traps in Golf Betting
The most dangerous trap in golf odds is the one that looks like value but is actually a price the market has got right and you have got wrong. After a decade of live betting, I have catalogued the traps that catch me and other experienced punters most often.
Overbet favourites are the first trap. When a player wins a major or a high-profile event, the market shortens his odds for the following week beyond what his underlying performance data justifies. The public bets names, not numbers, and the post-victory hype inflates the favourite’s price at the expense of the rest of the field. Conversely, the rest of the field drifts slightly to accommodate the shortened favourite, creating value opportunities further down the market. I specifically look for players in the 30/1 to 60/1 range the week after a major, when the market’s attention is fixated on the top three or four names.
Course-history bias is another common trap, and it cuts both ways. A player who has won at a venue twice in the past five years will be priced as if his course form guarantees a repeat. The market overpays for a small sample of historical success. On the other side, a player with no course history at a new venue is often underpriced because the market defaults to his world ranking or recent form, ignoring the fact that his SG profile might be an excellent match for the course type.
The third trap is ignoring field size in each-way markets. A 156-player event and a 72-player event produce very different probability distributions, but casual punters evaluate odds in isolation. A player at 40/1 in a field of 156 faces far more competition for a top-8 place than a player at 40/1 in a field of 72. Adjusting for field size is a basic step that many punters skip, and it leads to systematically overvaluing E/W bets in large-field events and undervaluing them in smaller fields.
Golf Odds: Your Questions Answered
Why are golf odds so much longer than football or tennis odds?
Golf fields typically contain 144 players, meaning even the best golfer in the world has a relatively low probability of winning any given event. In football, two teams share 100% of the win probability. In golf, that probability is divided across 144 competitors, so the favourite might be 8/1 or 10/1 where a football favourite would be 4/9.
How quickly do golf odds change during a live round?
Automated pricing systems at most UK bookmakers update golf odds within 20-30 seconds of a confirmed score change. During high-traffic moments – a leader’s eagle or a contender’s double bogey – the adjustment can be even faster. The speed has increased significantly over the past three years as data feeds from providers like Sportradar have become more granular.
What does each-way odds at 1/5 the price mean?
It means the place part of your each-way bet is paid at one-fifth of the win odds. If a player is 50/1 to win, the place part is settled at 10/1. So a GBP 10 each-way bet (GBP 20 total) on a player who finishes in a place position but does not win would return GBP 110 – the GBP 10 place stake multiplied by 10/1, plus the original GBP 10 place stake.
How do I calculate my return from fractional golf odds?
Multiply your stake by the fractional odds to get your profit, then add your stake back to get the total return. A GBP 10 bet at 25/1 returns GBP 260 total – GBP 250 profit plus your GBP 10 stake. For each-way bets, calculate the win part and place part separately using the relevant odds and terms.
Reading Odds Is the First Step – Using Them Is the Edge
Understanding odds formats, implied probability, overround, and price triggers is the foundation – but foundations do not win bets on their own. What separates a punter who understands odds from one who profits from them is the discipline to calculate before placing, the patience to compare across bookmakers, and the awareness to recognise when a price reflects genuine value versus when it reflects a market trap that catches the unwary.
Golf odds will only become more dynamic as data infrastructure expands and micro-markets introduce shot-level pricing to the UK market. The punters who invest time now in understanding the mechanics behind the numbers – not just reading them, but interrogating them – will be best positioned to profit when the market’s complexity increases further. Start with the overround. Calculate it for this week’s tournament. Compare it to last week’s. The numbers will tell you more than any tipster ever will.
Published by the Live Golf Betting team.